Citizen Science Project: Three-Sided Coin

Introduction:

In the article, “Developments towards Mathematical Citizen Science”, Anna M. Hartkopf mentions a theory by Matt Parker on a three-sided coin. He posted to Twitter asking for help on determining the thickness of a coin so that the coin would land on its edge ⅓ of the time. He created his own website in which he provides a video introduction of determining the thickness of a coin, how to make various three-sided coins, and how to test those out to determine if it will land on its edge ⅓ of the time. For this project, you will watch the video provided, create various three-sided coins, use mathematics to determine surface area and thickness, and test your coins through trial and error to determine if they can create a coin that will land on its edge ⅓ of the time, and determine what that thickness must be. 

Objective:

To investigate Matt Parker’s question: How thick is a three-sided coin? You will create various three-sided coins with different thicknesses and determine if any of their coins land on its edge ⅓ of the time. 

Materials:

Step 1: Engage

The lesson will begin by asking you to think if it is possible to create a three-sided coin would be able to land on “heads”, “tails”, and its “edge”, equally ⅓ of the time. You will look at a quarter, nickel, dime, and penny to observe and use what you know and create your own hypothesis to determine your answer. You will write whether or not they you think there is a three-sided coin that would be able to land on each surface ⅓ of the time, along with an explanation. After, you will discuss your hypothesis and share their thoughts aloud. I will then show you the Three-Sided Coin Introduction Video, to introduce you to the lesson. Afterwards, you will discuss what you saw in the video, and if your hypothesis changed thus far. You will then be broken into groups of 4-5 people, in which you will investigate this topic even more.

Step 2: Explore

You will begin your study by first answering the questions below. These are the worksheets provided by Matt Parker on Think Math’s webpage.

You will then answer the questions:

  1. How could we estimate experimentally the probability that a particular coin lands its edge?
  2. How might we make a coin of a given thickness?
  3. What would need to be true of the material making up the inside of the coin, in order to make the probabilities depend only on the thickness of the coin?
  4. What else might affect the probability? If you want to compare across throws, how can you make sure your test is fair?

After answering these questions, you will move onto Method 1, in which you look at the coin and the sphere. 

A formula you might find useful:

The Surface Area (SA) of the shaded region is: 2πrt

1) Write down the surface area(SA) of the sphere in terms of r:

2) Given the SA of the shaded region is one third of that of the sphere, Write r in terms of t:

3) Consider the right angled triangle and write a formula that connects h,t and r:

4) Can you use these last two results to find the ratio between h and t?

After exploring the coin and sphere, you will move onto Method 2, which is the coin and the circle.

1) Find the angle x, given that the two dashed arcs make up one third of the circumference:

2) Find the angle y.

3) Use right-angled triangle trigonometry, and the angle y, to find the ratio between h and t.

After you conduct the two methods, you will then create your own three-sided coins. Each group will create 3 different three-sided coins, each made from different materials. you will label with a pen, H on one flat side and T on the other flat side. You will use the following chart to toss their coins and record your answers. You will use one sheet for each coin, totaling three data sheets. 

After you have investigated your three-sided coins, you will use GeoGebra to create a bar graph for each of your three-sided coins, with the number of times it landed on heads, tails, and the edge. You will then look at Jen Rogers’ calculations to determine if your results are statistically significant.

After you review Jen’s work, you will determine if your coins are statistically significant or not. You will write down why or why not and use evidence to support your answers. You will then input your work into the Google Form Submission, the Matt Parker set-up on Think Math’s webpage. You will then go back to your original hypothesis and determine if you were correct when you stated whether or not there could be a three-sided coin in which it would land equally on ⅓ on each of the faces and the edge. 

Step 4: Social Media

After you have collected and analyzed their data, you will post on Social Media. You will start by creating your own Twitter Group account and reply to Matt Parker’s original tweet with your findings, as well as your own thoughts. You are encouraged to use hashtags, as well as view other people’s posts on the twitter thread. In addition, you will reply to this blog post with in a comment under my blog with your findings and data analysis.

If you have any questions, please contact me at ccolechn@buffalo.edu.

Have fun! 🙂

Reminder- Project Due 11/6!

Your PowerPoint presentation, Video, Song, or skit is Due Next Friday, 11/6/20.

Make sure you 

  • Demonstrate the profession you chose
  • Show how math is used every day
  • State why it is important
  • What skills and schooling you would need in order to go into that profession

Also, be creative! I want to see visuals, texts, and different colors and fonts.

If you have any questions, please email me!

Mrs. Olechnowski 🙂

Unit Review – Test 10/30/20!

Hello All! 🙂

We have finished our Unit on Linear Functions. 

In this Unit you have learned:

  1. Using graphs to relate two quantities
  2. Patterns in linear and non-linear functions
  3. Graphing and writing a function rule
  4. Formalizing relations and functions
  5. Rate of change and slope
  6. Slope-intercept form
  7. Point-slope form
  8. Standard form

For Homework I want you to complete the attached Review Sheet:

 8TH GRADE REVIEW SHEET

It is due, Thursday 10/29 and we will be going over it during class. 

**YOUR TEST IS THIS FRIDAY, 10/30/20!!**

Here is a recap of some of the major concepts we learned this Unit:

Image result for relation and function examples

Image result for slope intercept point slope and standard form

Image result for slope intercept point slope and standard form

Photo credit: https://virtualnerd.com/worksheetHelper.php?tutID=Alg1_10_1_18

Image result for function rule

**This video provides a recap of this unit as well. Please feel free to watch this video to study!**

** You can also visit Khan Academy to review Linear Functions. The website provides videos for the different topics as well as practice problems. It is a great website to review and to help you with your review sheet. **

Again, your review sheet is due TOMMOROW, 10/29 and your test is FRIDAY, 10/30 !

Please email me if you have any questions! 

Homework Due Monday 10/27/20

Over the weekend I would like you to watch this Video.

This video is a clip from the TV Show, Person of Interest.

I want you to watch this video and answer the follow questions in a short paragraph. 

  1. What did you think of the video?
  2. Have you ever felt the way the students did?
  3. What did you learn from the video?
  4. Why do you think I showed this video to you?
  5. Write an questions/comments/concerns you want to share with me.

We will review these questions for our Warm-Up on Monday.

Image result for homework meme

Photo credit: http://mrelkinswebpage.weebly.com/sec-i-geo-homeworknews.html

Writing Linear Equations

Tags

, , , ,

Today in class you learned how to write a linear equation using the slope formula and the y-intercept. Reference the following as a review!

The general form to write a linear equation is in slope-intercept form.

Photo credit: https://slideplayer.com/slide/7447234/

The slope formula is: 

To use this formula you take two given points and plug them into the equation.

For Example:

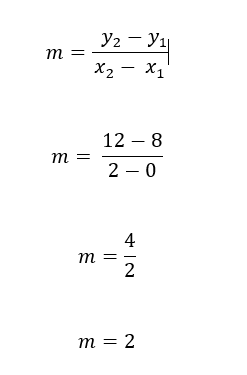
Find the slope of the points (0, 8) and (2, 12).

Label (0, 8) as (x1, y1) & (2, 12) as (x2, y2)

 slope formula

Now that you have your slope as 2, you need to find the y-intercept in order to write a your linear equation.

**Remember that the y-intercept is the point where the line crosses the x-axis. **

For Example look at the following graph. You can see that the where the line crosses the y-axis is your y-intercept.

Photo Credit: http://www.mathwarehouse.com


What is the x-coordinate at that point?

If you guessed 0, you are correct! 

** The x-coordinate for any y-intercept will always be 0! **

Now if we refer back to our two original points, they were (0, 8) and (2, 12).

Knowing that in the coordinate (0, 8) the x-coordinate is 0, therefore our y-intercept must be 8.

So now, we know our slope is 2 and our y-intercept is 8. Our last step is to plug it into slope-intercept form.

y = mx + b

m = 2 and b = 8

y = 2x + 8

There are times where one of the points won’t contain the y-intercept. In order to find the y-intercept you must plug the one of the points and the slope into y = mx + b in order to solve for b. 

Directions for Assignment:

  1. Watch the following  video from Khan Academy to see more problems on how to solve for the y-intercept of an equation given any two points. 
  2. If you would like to practice some problems before taking your HW Practice Assessment, click “Practice: Slope-Intercept from two points” which is located on the left side of the screen next to the video. If you can’t locate it, click this link.
  3. After you have watched the video and solved some practice problems, click on the following link and solve the problems! We will review the problems and responses in class tomorrow!

If you have any problems or concerns, please email me at ccolechn@buffalo.edu 

Project: Why is Math Important?!

Every day I hear students say:

“Why are we learning this?”

&

“When will we ever use this in real-life?”

I WANT YOU TO DO THE RESEARCH ON THAT!

Directions:

  • You are to work in groups of 3-4 people (You Choose!
  • Read the Following Article: 10 Reasons Why Math Is Important in Life
  • Based upon the article, choose a career in which Math is used every day in that profession
  • Create a Google Slides Presentation which demonstrates the profession you chose, how math is used every day, why it is important, and what skills and schooling you would need in order to go into that profession
  • Remember to be Creative! Add pictures, charts, and visuals to your project
  • As a group you will present your project to the class, during our Google Meets. (I will assign each group a time on 11/6/20.)
  • Since we cannot meet in person, use Google Meets to work collaboratively on your project.
  • If you have any questions, email me!

This Project is Due: FRIDAY, 11/6/20!

Image result for why is math important